Hello World,
welcome to Computation Debate 1, my new personal blog. My name is Eugenio Palmieri and I’m a Master’s student in Statistics at Florence University (Italy) and I want to write mainly about statistics, informatics and programming2, but I’m interested also in economics, politics, urban planning, mathematics and other nerdy topics.
Feautures of the blog:
I want to describe with some examples the main features of the blog, especially for other statistics or other R (a programming language) users like me. In my next post I am going to explain how to build a blog like this for free.
I don’t plan to make all my posts about programming or topics for nerd, I want to make more accessible contents in the future, but, for now, if you aren’t into this kind of things, I warn you that your eyes could bleed.
Integration with R:
One of the main feature of this blog is that it supports Rmarkdown files, which make it possible to create post from Rstudio to generate directly graphs, tables and interactive html widgets with R3, like in this graph example:
library(ggplot2)

data=data.frame(cond = rep(c("condition_1", "condition_2"), each=10), my_x = 1:100 + rnorm(100,sd=9), my_y = 1:100 + rnorm(100,sd=16) )

ggplot(data, aes(x=my_x, y=my_y)) + geom_point(shape=1) +
geom_smooth(method=lm , color="red", se=TRUE)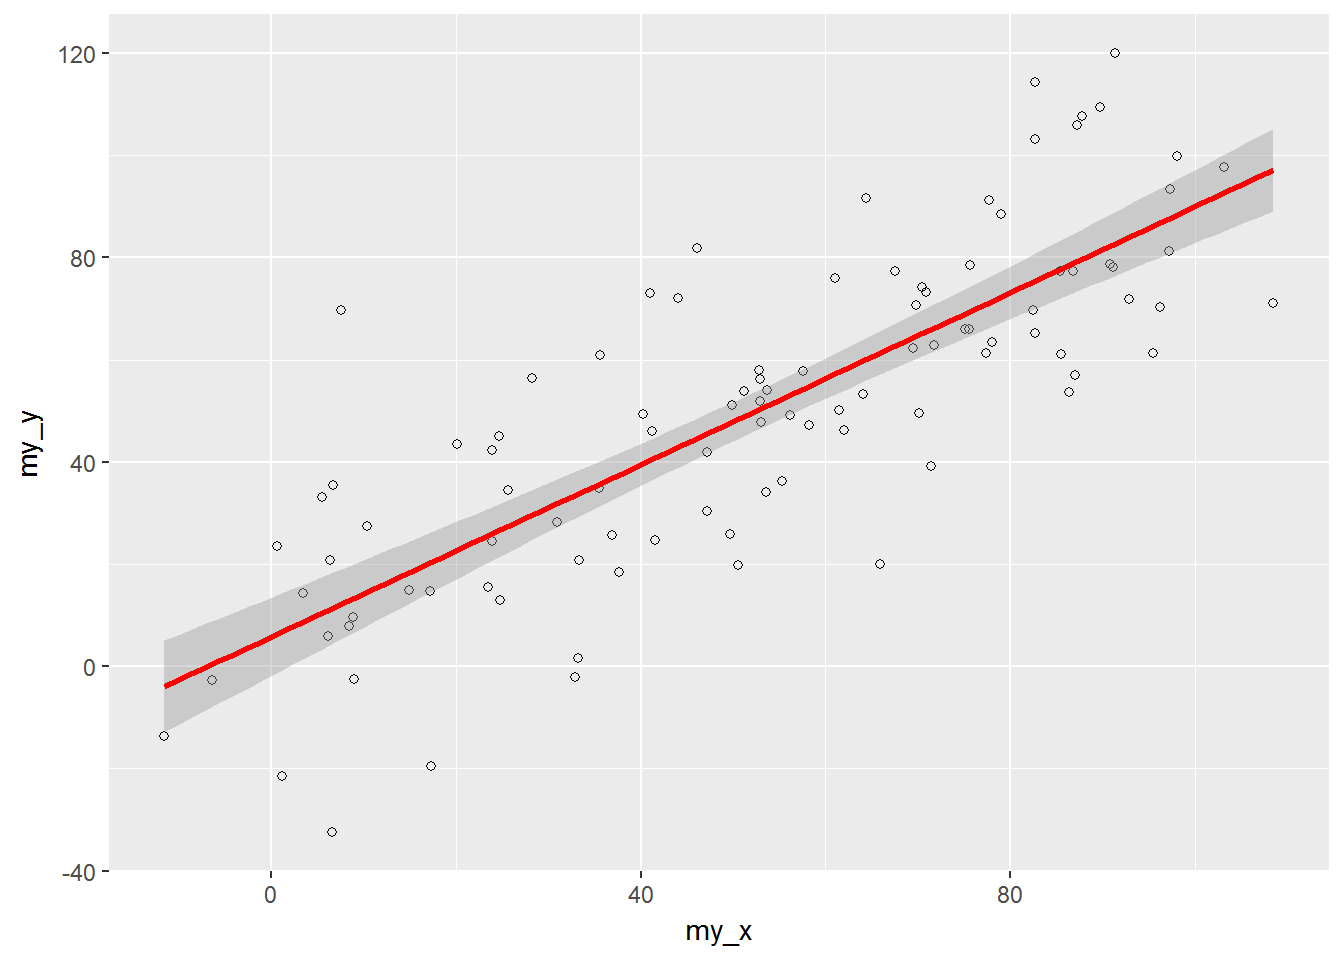
Or in this example of interactive time-series chart:
library(dygraphs)
lungDeaths <- cbind(mdeaths, fdeaths)
dygraph(lungDeaths)%>% dyRangeSelector()
Support for \(\rm \LaTeX\) math expressions:
Anothere important feauture is the support for \(\rm \LaTeX\) to write equations and formulas:
$$\mathbf{y} = \mathbf{X}\boldsymbol\beta + \boldsymbol\varepsilon$$\[\mathbf{y} = \mathbf{X}\boldsymbol\beta + \boldsymbol\varepsilon\]
Other programming languages:
With the knitr package is possible to use chunks of code from other language engines (like Python, C, Ruby, SQL, Bash, Rcpp, Stan, JavaScript, Perl, SAS, Scala and CSS) directly from Rstudio .
C++
This is an example of C++ code compiled through the Rcpp4 package, inside a {r engine='Rcpp'} code chunk:
#include <Rcpp.h>
// [[Rcpp::export]]
double sumRcpp(const Rcpp::NumericVector& x) {
    std::size_t n = x.size();
    double total = 0;
    if (n > 0) {
        for (std::size_t i = 0, k = n - 1; i < k; ++i, --k)
            total += x[i] + x[k];
        if (n % 2 == 1)
            total += x[n / 2];
    }
    return total;
}
Compare, in a R chunk of code5, the new defined sumRcpp() function with the normal R sum():
library(microbenchmark)
library(ggplot2)
theme_set(theme_bw())
bench <- function(..., n = 10e2 * 1:10e2, times = 100) {
    exprs <- as.list(match.call(expand.dots = FALSE)$...)
    nexprs <- length(exprs)
    nout <- nexprs * times
    out <- list(n = integer(nout),
                expr = factor(integer(nout), levels = as.character(exprs)),
                time = numeric(nout))
    for (i in seq_along(n)) {
        start <- (i - 1) * nexprs + 1
        end <- start + nexprs - 1
        x <- runif(n[i])
        res <- microbenchmark(list = exprs, times = times)
        res <- stack(lapply(split(res$time, res$expr), median.default))
        out[["n"]][start:end] <- n[i]
        out[["expr"]][start:end] <- res$ind
        out[["time"]][start:end] <- res$values
    }
    class(out) <- "data.frame"
    attr(out, "row.names") <- .set_row_names(length(out$n))
    gp <- ggplot(out, aes(x = n, y = time, linetype = expr, color = expr)) +
        geom_smooth(se = FALSE)
    print(gp)
    invisible(out)
}

bench(sum(x), sumRcpp(x))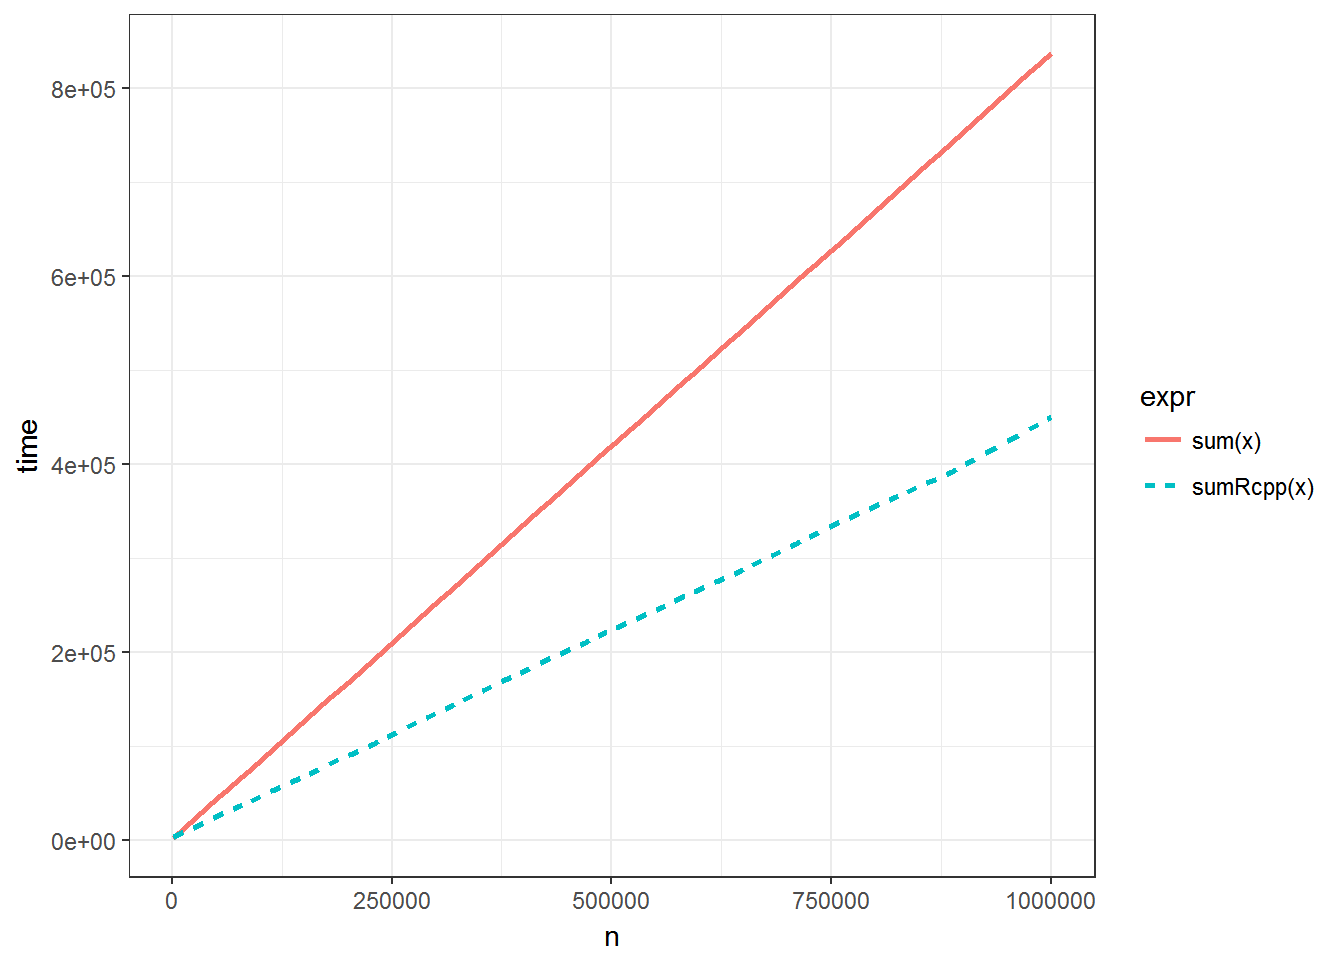
Python
Using the Python Engine directly from Rstudio, inside a {python} code chunk:
import sys
print(sys.version)
## 3.5.2 |Anaconda custom (64-bit)| (default, Jul 5 2016, 11:41:13) [MSC v.1900 64 bit (AMD64)]It is even possible to exchange data frames from R and Python via a file system with the feather package.
Modify the structure of the blog with Widgets
The original structure of the site after the installation is like this. I made some modification, deleting some widgets (part of the site) I wasn’t using. If you want to know more about the widgets supported by this template, look here at the documentation.
Build your own blog for free!
If you are interested in building a blog like this for free, you can read the new post I’ve made to explain how to create a blog with Hugo and Github with the blogdown package, directly from Rstudio.
The title is inspired by the Socialist calculation debate and by Kantorovich and his works, like Mathematical Methods of Organizing and Planning Production.↩
I’m using mainly R with RStudio, but I have some basic experience with Stata, Systat, GeoDa, Qgis, Markdown, Rmarkdown, LaTex and I’m intentioned to learn Python.↩
R is a a free software environment for statistical computing and graphics and Rstudio is an integrated development environment (IDE) for R.↩
The
Rcppis slightly different from the other languages that can use the engine directly, with something like{python, engine.path="/Users/me/anaconda/bin/python"}.↩I suggest you to use the option
cache = TRUEin the chunk of codes that need a relatively long time to run, so it will save the output and the code won’t run every time you use theblogdown:::serve_site()command.↩